Click the upper right corner and
select browser
to open it.

Click the upper right corner and
select browser
to open it.
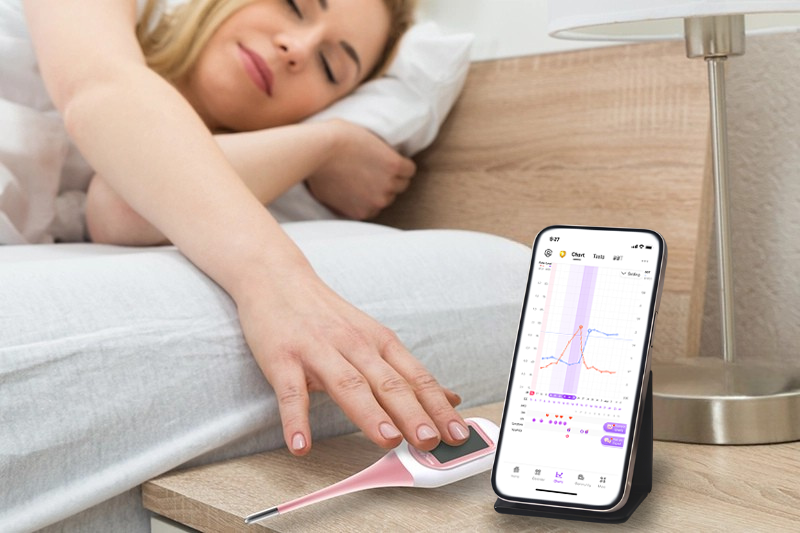
Basal Body Temperature (BBT) is your body temperature at rest, and can only be accurately taken immediately when you wake up.
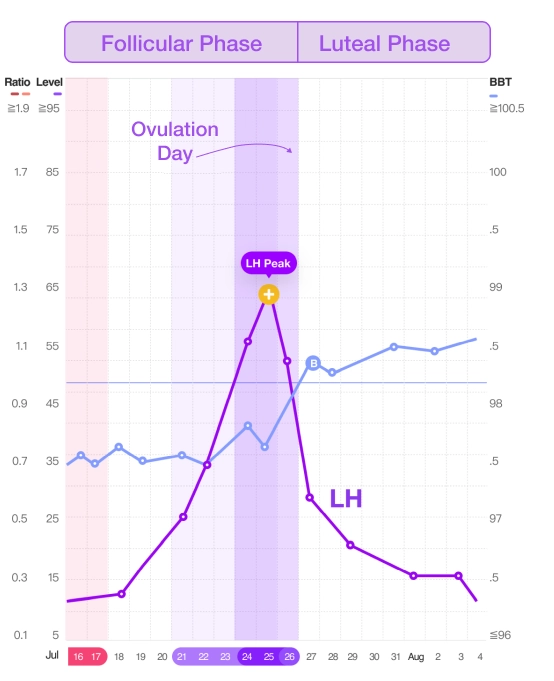
An increase of 0.5-1ºF indicates the BBT spike, and occurs one-to-two days after ovulation. The purpose of tracking and creating a BBT chart is to find the BBT spike. Traditionally, women take their body temperature and manually mark the reading on a printed fertility chart. Then, they figure out the spike day after consecutive readings.
A coverline is a horizontal line in your BBT chart drawn directly above the last temperature before the BBT spike (see the orange line in the graph above). The purpose of this is to separate preovulatory temperatures from postovulatory temperatures so that the BBT spike can be more evident: you will clearly be able to visualize the difference between the series of lower preovulatory temperatures underneath the coverline, and the series of higher postovulatory temperatures above the coverline.
Thanks to the rapid development of A.I. (Artificial Intelligence), you can sync your BBT to the fertility chart on the Premom ovulation predictor, which will create the coverline for you.

You may ask: if the BBT spike occurs after ovulation, how can it help make predictions for ovulation?
This is because a normal woman’s Luteal Phase (the phase after ovulation day till the next period day) will always be the same number of days, not fluctuating by even one day.
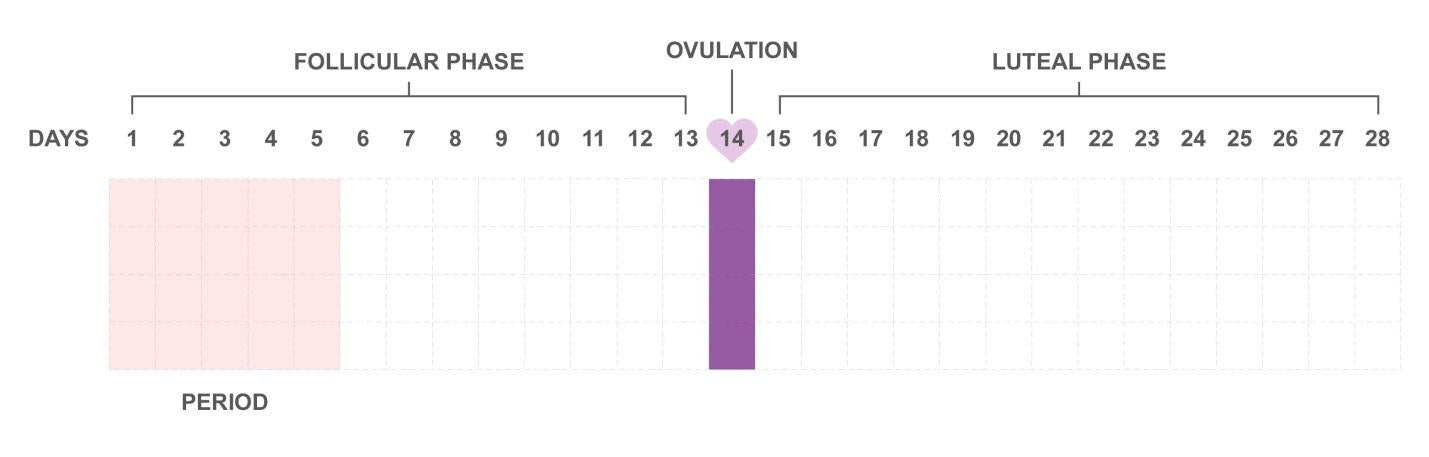
Therefore, if you know both the length of your Luteal Phase – and when you will get your next period, from a proven, accurate period predictor – your next ovulation day can be calculated.
A simple formula is as below.
Your Next Period Day – Luteal Phase Length = Next Ovulation Day
Your Current Ovulation day + Luteal Phase Length = Your Next Period Day
Therefore, you can calculate when you will ovulate next if you know the number of days in your Luteal Phase and if you know your next period day. And you can calculate your next period start date if you know your Luteal Phase length and the ovulation day of your current cycle.
The best-suited BBT chart users are healthy, have a regular life schedule, and have a consistent wake up time. These women could choose a basal body temperature chart as an ovulation calculator.
We highly recommend the BBT chart to women who have PCOS, LUF, a short LH Surge, or low LH Surge levels, because these women can use a BBT chart paired with ovulation tests to confirm that ovulation has occurred.

The Premom Ovulation Calculator app automatically syncs your basal body temperature after it is paired and connected with the Easy@Home basal thermometer.
Premom can calculate ovulation regardless of the huge variety in BBT spike patterns because it has such an advanced algorithm in regards to fertility awareness.
The most challenging part of charting BBT is reading the chart and figuring out when the BBT spike occurs. However, the Premom app can automatically calculate and draw the coverline in the chart for users to see their own BBT spike.

To obtain a coverline in the Premom app, ideally, certain criteria should be met based on the logged basal body temperature. These criteria are as follows: To enable Premom to display the BBT spike and draw a coverline, it is suggested that you record at least nine consecutive temperatures in the app. You can either manually enter the basal temperature from any basal thermometer you are using or use the Easy@Home basal thermometer, which automatically syncs with Premom via Bluetooth. Without using Premom, many women have to take their basal temperature every day throughout their entire cycle, trying to find the BBT spike out of all the temperature readings. After using Premom consistently, the app will understand your pattern better, and you can reduce the temperature-taking to the minimum while still catching your BBT spike. When connected with the Easy@Home smart basal thermometer, BBT charting can be as easy as 1, 2, 3! 1. Upon waking up, turn on the thermometer and put it under your tongue. Then relax! 2. When you hear the double beep after less than two minutes, it is done. 3. Your temperature is recorded and automatically syncs to your app tracker!